1.
A person in a car drives away from a stop sign, cruises at a constant speed, and then slows down as she approaches another stop sign. Which graph best represents this situation?
2.
Gail leaves the house for her morning jog. She stops for a quick drink, then continues jogging before stopping again to chat with a friend. She then jogs back home. Which graph best represents Gail's run?
3.
This graph shows the height of the tide in a harbour as a function of time in one day. Which statement best describes the tide at Point C?
4.
Determine the range of the relation graphed at the right.
5.
This graph shows the free-fall speed of a skydiver as a function of time. Which statement best describes what is happening for line segment BC in the graph?
6.
Find the domain of the graph.
7.
Different colours of marbles can be associated with the number of marbles in a bag. Consider the relation represented by this arrow diagram. Represent the relation as a graph.
8.
Identify the domain of this relation \( \{(8,10),(5,7),(9,-11),(6,-8)\} \).
9.
The relation between x and y is linear. Which ordered pair completes this table of values?
10.
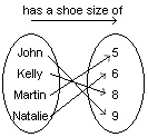
The graph and the arrow diagram represent the same relation. The graph is correct but the arrow diagram is not. Which pairing in the arrow diagram is correct?
Given two graphs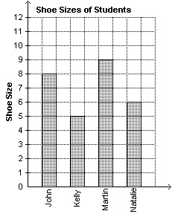
11.
What is the range of the function shown in the graph?
12.
The relation between x and y is linear. Which number would complete this table?
13.
A retirement home ordered canvas shopping bags for 90 residents. This graph shows the cost of the shopping bags, \(C\) dollars, as a function of the number ordered, \(n\). Suppose one more shopping bag was ordered. What would be the increase in cost?
14.
Capital cities can be associated with the province or territory they are in. Describe this relation in words.
15.
Which equation does not represent a linear relation?
16.
Determine the domain of this graph.
1 out of 1